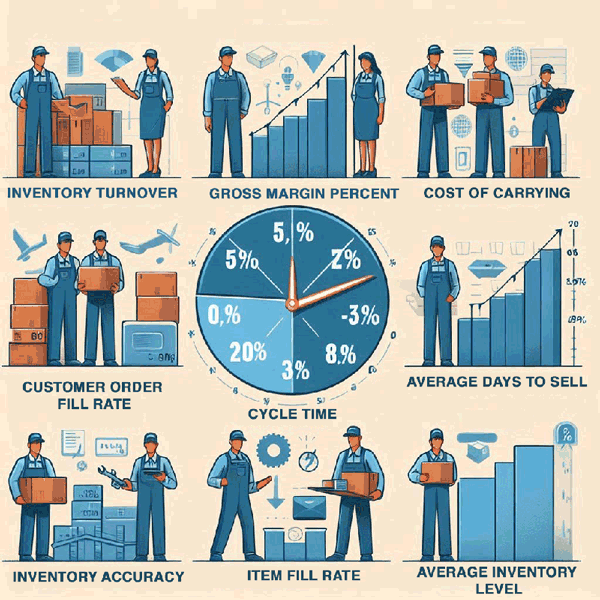
Maintaining optimal inventory levels is a constant challenge for businesses of all sizes. Too much stock ties up valuable capital and increases the risk of obsolescence, while too little stock leads to missed sales and frustrated customers. Fortunately, by tracking key inventory management metrics, you can gain valuable insights into your stock levels, sales performance, and overall efficiency.
Inventory management is a complex balancing act. Too much stock ties up capital and risks obsolescence, while too little leads to stockouts and unhappy customers. That's why tracking the right inventory management metrics is crucial. These metrics, often called Key Performance Indicators (KPIs), provide the insights you need to make informed decisions, optimize your inventory, and boost your bottom line.
In this guide, we'll dive into the essential inventory management metrics that every professional should be tracking, along with their significance and how they can help you streamline your operations.

Essential Inventory Management Metrics
1. Inventory Turnover Rate
- What it measures: How often you sell and replace your entire inventory within a given period (usually a year).
- Why it matters: A high turnover rate indicates strong sales and efficient use of inventory, while a low rate might signal excess stock or slow-moving products.
- How to calculate: Cost of Goods Sold (COGS) / Average Inventory
2. Fill Rate
- What it measures: The percentage of customer orders that are fulfilled from available stock on hand.
- Why it matters: A high fill rate reflects excellent customer service and efficient inventory management, while a low rate can lead to lost sales and disappointed customers.
- How to calculate: (Total orders fulfilled / Total orders placed) x 100
3. Inventory Accuracy
- What it measures: The accuracy of your inventory records compared to the actual physical inventory.
- Why it matters: Inaccurate records lead to poor decision-making, stockouts, and excess inventory. A high accuracy rate ensures you have a clear picture of your stock levels.
- How to calculate: (Number of items accurately counted / Total number of items counted) x 100
4. Days Sales of Inventory (DSI)
- What it measures: The average number of days it takes to turn your inventory into sales.
- Why it matters: A low DSI indicates that your inventory is selling quickly, while a high DSI might signal slow-moving or excess stock.
- How to calculate: (Average Inventory / COGS) x 365
5. Gross Profit Margin
- What it measures: The percentage of revenue remaining after deducting the cost of goods sold.
- Why it matters: It reflects the profitability of your inventory and pricing strategies. A higher margin means more profit per sale.
- How to calculate: (Revenue - COGS) / Revenue x 100
6. Carrying Costs
Additional KPIs to Consider
- Backorder Rate: The percentage of orders that cannot be fulfilled immediately due to insufficient stock.
- Inventory Shrinkage Rate: The percentage of inventory lost due to theft, damage, or errors.
- Lead Time: The time it takes to receive an order after it's placed.
- Reorder Point: The inventory level at which you need to place a new order to avoid stockouts.

Leveraging Inventory Management Systems
Tracking these metrics manually can be a daunting task. That's where inventory management systems (IMS) come in. A robust inventory system automates data collection, analysis, and reporting, giving you real-time visibility into your inventory performance.A QR Inventory system offers a comprehensive solution for tracking your inventory and assets and generating insightful reports.
Conclusion
By understanding and tracking the right inventory management metrics, you gain valuable insights. These insights empower you to make data-driven decisions, optimize your inventory, reduce costs, and ultimately improve your overall business performance.Ready to streamline your inventory management? Contact us today for a free consultation to discover how we can help you transform your business and achieve your goals.
